This may be one of the more obvious posts I have made on my blog. The return of five-time All-Star Chase Utley to the Phillies line-up has added a much needed spark. In 21 games, 20 starts, Utley has hit .275/.383/.500 with 3 HRs, 12 RBIs, 3 SBs, and 12 walks with excellent defense. But as hard as it may be to believe now, many commentators thought Utley was done upon his return. When comparing run trends on May 28, I found that the Phillies were scoring just under the league average in runs per game and speculated that it would get better once Utley and Dom Brown readjusted and adjusted, respectively, to Major Leauge pitching. That has happened: the Phillies have added .12 runs per game to their average in just 24 games since Utley’s return and have a .9 runs per game differential, .4 runs per game higher than the next closest team (Cincinnati). The Phillies now have the second highest runs per game total in the National League among division leaders and are now .1 runs per game above the league average instead of .02 below it.
Chase returned on Monday May 23, 2011 against the Cincinnati Reds, going 0-5 with a strikeout in a 10-3 Phils win. He followed it up with a 1-4 night, a day off, and a 1-5 night, putting him at 2-14 to start his season. But since his return, the Phils have caught fire, posting a 16-8 record including their active 7-game winning streak. Undoubtedly, the Phils have benefited from having the three top pitchers in the league in xFIP (Halladay, Hamels, and Lee), but Utley’s .8 WAR in just 21 games out-paces replacements Wilson Valdez at -0.7 and Michael Martinez at -0.3, adding somewhere between 2 and 2.4 wins immediately to the Phils if adjusted for playing time.
Below are some graphical illustrations of the Phillies’ offensive success since Utley’s return. They’ve won 16 of 24 since his return, 13 of 20 when Utley starts, have scored a full run more per game since his return, and score 1.2 more runs per game with Utley in the line-up. Click each graph to expand.
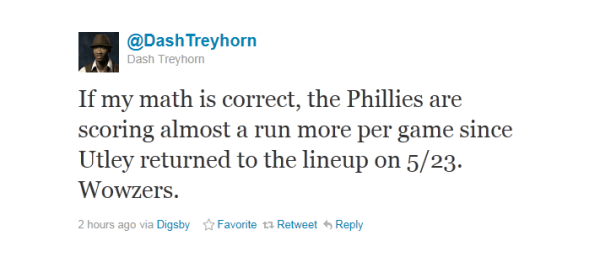
Update: Saw Dash’s Tweet at about 12:30 PM when I stepped away from lunch. Did not see that he had posted an article very similar to mine an hour before I did. Dash’s is a little less optimistic, and honestly, more responsible in his assessment that it is all not Utley. The Phils have had great pitching and Valdez and Martinez are obviously not MLB starting second basemen material, but Utley has definitely had an impact in a small sample size.
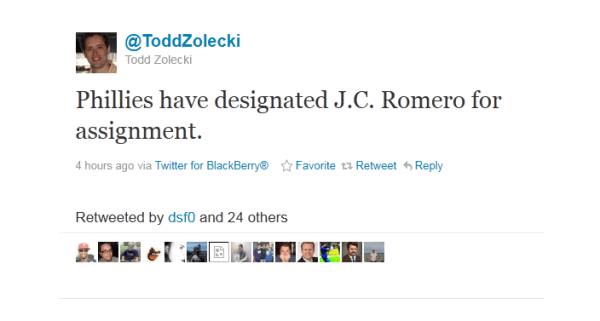
Phillies beat writer Todd Zolecki Tweeted shortly after the completion of today’s game that J.C. Romero was designated for assignment to make room for Vance Worley, who will be starting Saturday’s game against the Seattle Mariners. Romero’s designation comes as little surprise to many Phillies’ fans who saw Romero struggle with control and was unable to get lefties out in his primary role as a lefty specialist. A few weeks back, I had posted a silly graph in frustration at a Phillies loss. J.C. must be a fan of nice, round numbers:
Romero’s inability to prevent runners from reaching base was particularly frustrating to watch because of his excellent performances for the Phillies in 2007 and 2008 that arguably resurrected his career. Unfortunately for Romero, he’s either been suspended, injured, or ineffective for most of the time period following 2008. Click the thumbnails to view the graphs at full size.
In the first graph, you’ll notice that Romero hasn’t pitched nearly close to his career average in innings, a career average that includes the last three seasons with the Phillies in which he saw limited action. The most telling numbers in the first graph were that his BB/9 IP were at least a walk and a half higher than his career average and his K/9 IP were at least .4 K lower than his career average. The second graph, in its most basic sense shows that his Walks+Hits/Innings Pitched (WHIP) not only gradually increased over the last three seasons but all three years was much higher than his career average and that his stirkeouts to walk ratio dipped significantly compared to his career average. Looking back on DFA’ing Romero, is this something the Phillies should have done sooner? Loyalty for his contributions in 2007 and 2008 no doubt played a large role in offering him a one-year deal in late December. But with the emergence of Antonio Bastardo as the Phillies preeminent lefty specialist, it appears there is no longer a role on the Phillies for Romero.
Follow @EatThisNotThat on Twitter for helpful food substitutions that help fine tune your diet. Now owned by Men's Health, they not-so-coincidentally offer many suggestions that are found in the MH's 125 Best Foods For Men list.
Day 2 started off positively not unlike Day 1 (See how that went down, here). At the recommendation of Men’s Health’s 125 Best Food’s For Men list published in the November 2010 issue, I started my day with what they listed as the best oatmeal for men, Quaker Weight Control Instant Oatmeal. The guide suggests Cinnamon flavor, but I bought the variety pack. I prefer the Banana Bread flavor which they don’t sell individually. Oatmeal has a tremendous array of health benefits, mostly from the high amounts of fiber, which have very positive health effects, it contains and the low amounts of sugar. Quaker Weight Control brand has only 1 gram of sugar, against 6 grams of fiber, along with a strong 7 grams of protein for 160 calories per package. I started the day off with two of these mixed with hot water, for 320 calories, 2 grams of sugar, 12 grams of fiber, and 14 grams of protein.
For an in between snack, I had a plain Chobani Greek yogurt topped with organic blueberries. I would have this twice, so we’ll say the blueberries, about 10 berries each time, plus the yogurt equaled about 220 calories, 20 grams of protein, a gram or two of fiber from the blueberries, and the added benefit of flavor and cutting about 80 calories per Chobani from the prepacked Chobani blueberry flavor thanks to erasing the sugar heavy blueberry mix they use. For the record, I use Self’s Nutrition Data calculator for foods that don’t have nutrition facts printed on them. It’s a particularly awesome tool for health junkies.
Right out of the gate, I’ll add in my three protein shakes, one pre-workout, one post-workout, and Cassein protein directly before bed for about 550 more calories and 120 more grams of protein. The total for the day so far is 1090 and we’re cruising right along.
For me, lunch has always been my toughest meal. It is easy for me to avoid bad foods when I wake up because oatmeal, yogurt, and protein shakes are such quick, cheap, easy, and healthy foods that they can be had on the go and had without much thought. Dinner is easier for me than lunch because when eating dinner, I have a “looking down” view of what I ate that day. It’s easier for me to finish strong on a strong day or even finish strong a day when my eating habits have been weaker. Every meal is a chance to make a great decision for your body.
And Day 2’s lunch was no doubt a trap meal. Or it should have been. My family and I went to the Olive Garden to celebrate me obtaining my first real employment opportunity. I thought I would have a light lunch by ordering the soup, salad, and bread sticks with an unsweetened iced tea. For my soup, I had one bowl of Pasta e Fagioli which appeared to be the most healthy of the choices. It turns it out, it was. It has only 130 calories, 17 carbs, but a whopping 6 grams of fiber, with the lowest sodium of any soup on their menu, 680 mg, which is half as much as any other soup on the menu. The unsweetened iced tea has 0 calories other than maybe one or two from the lemon I squeezed into it and it does have plenty of anti-oxidants. Freshly brewed teas, black or green, has a load of anti-oxidants and keeps you hydrated with a hint of caffeine. So the first two choices were positive ones, but the one that wasn’t may surprise you.
While I haven’t been particularly been mindful of fat, I do try to keep saturated fats out of my diet. I have done this mostly irresponsibly, anecdotaly. Nina Teicholz of Men’s Health points out that it has never been proven that saturated fats are particularly bad for you. Ancel Keys, who won a Nobel Prize for his hypothesis regarding saturated fats, conveniently threw out data that proved his hypothesis inconclusive as pointed out in the docu-comedy Fathead, which is my favorite film that I’ve seen in the last year. What this segue is leading to is that I ate the salad at Olive Garden and it is surprisingly high in saturated fats.
One serving of the salad, which is all I consumed, has 26 grams of fat, anticipated because of the olive oil used in the dressing, and 4.5 grams of saturated fats. But the more I read about saturated fats, the less I am concerned about 4.5 grams here and there. I’ll just attempt to keep them moderate. The most surprising factoid about the Olive Garden salad is not the fat or the 350 calories, but the 1930 mg of sodium. According to the Mayo Clinic, American’s consume, on average, 3,400 mg of sodium per day, which is nearly 1,000 mg more than the daily recommended value. At 1,930 mg of sodium, the salad at Olive Garden nearly matches the daily recommended value for sodium intake for an adult consuming 2,000 calories a day. Two plates of this salad will put you at just under 4,000 mg. Absurd. High sodium levels are found in processed foods and sodium occurs naturally in almost all foods. The Mayo Clinic recommends that most adults should consume much less than the daily recommended value. Increased sodium levels creates high sodium levels in the blood which make your heart work harder and puts more pressure on your arteries. This increased pressure can lead to heart disease, stroke, kidney disease, and congestive heart failure. On a side note, I also had one breadstick for a ridiculous 150 calories, 400 mg of sodium, 5 grams of protein, 28 carbs, and just two grams of fiber. Bad sodium day.
The final caloric tally for the day was approximately 1720, under my daily goal, which in this case, isn’t necessarily a good thing; I finished the day at approximately 170 grams of protein. I could have used those extra calories to up my protein intake. The problem on Day Two was my sodium intake, which was offset by the four gallons of water and two unsweetened iced teas at Olive Garden. I completed a very successful chest workout, continuing a high reps, low rest, low weight routine with 10 minute warm-up cardio and 20 minute post-workout cardio. Going into Day 3, June 15, 2011, the goals were to 1.) Eat more, 2.) Lower sodium intake, and 3.) Eat more protein.
Here’s a preview of what happened yesterday; I found an old friend that I thought had died and gone to fast food heaven in Telford, PA:
I attended the Saturday match-up between the Lehigh Valley Iron Pigs and the Louisville Bats to see Brian Gordon pitch, who I had previously written about here. Gordon is a 32-year old pitcher, a converted outfielder at age 28, who achieved his dream of making the Major Leagues in 2008 with the Texas Rangers. Gordon was putting up eye-popping, video game like stats, including a sub-1.00 ERA going into Saturday, and who currently has thrown 56 strikeouts against only seven walks.
Saturday’s game was one of the roughest of the year for Gordon.Gordon struck out nine over 6 2/3 without walking anyone but gave up 2 home runs good for 5 runs, only 3 earned. The highlight of the game was Gordon’s 4th inning, 2-run center field shot.
With the Phillies winning three in a row and about to make it four tonight with Cole Hamels on the hill tonight, I went with a heavily Philly-influenced, Philly-artist playlist for my upcoming trip to the gym. All the links are YouTube links for the accompanying music video; artist links direct to Wikipedia.
Just in time for beach season, decided to fine tune the diet. Yesterday was day 1 of my 14 day clean streak goal. Some of my goals for the next two weeks:
Avoid fried foods
Avoid simple sugars
Eat 4-5 times daily
Maintain a 1/1 ratio of grams of protein consumed to body weight lbs
Maintain high fiber levels
Drink, drink, drink water
Avoid any beverage with calories
Maintain 2000-2500 calorie diet
Along with these fairly straight-forward, but difficult to follow, rules, I’ll be maintaining my plan of weight training five days a week, with a focus on high reps, high sets, low weight. My starting weight is 204 lbs with an estimated body fat, using this tool, of approximately 12.24%. My goal isn’t necessarily to lose weight but to increase muscle while decreasing body fat.
Day 1 was a success. Depicted above are some of the items I consumed. Chobani Greek Yogurt makes for a great snack many times throughout the day. Each individually packed plain Chobani is only 100 calories with an amazing 18 grams of protein per container. I really like their pomegranate and blueberry flavors but those add an extra 40-60 calories per cup as well as simple sugars that are added to create the texture of fruit on the bottom and the protein level decreases by 5-7 grams per cup when purchasing the fruit versions. Eating 3 plain Chobanis a day equates to only 300 calories with an awesome 54 grams of protein, 1/4 of my daily goal. These are also getting much cheaper; after being close to $2 per cup for much of last year, I have purchased them recently for $.88 a cup at Redner’s and $1.22 at Wal-Mart. And for those who are looking for them on the go, Wawa recently started carrying many varieties for $1.49 a cup. As popularity grows, I hope these will become even cheaper.
You will also notice in the photo the Arnold’s whole grain bread and natural peanut butter. I highly endorse Arnold’s bread; their is only 110 calories per slice and carbs and simple sugars are lower than most breads. Arnold’s has a wide variety of breads that are similarly delicious, including double protein and double fiber options, but their whole grain option fits directly in the middle of double protein and double fiber: 5 grams of protein per slice and 4 grams of fiber. Two slices to make a sandwhch makes it 220 calories of bread but 10 grams of protein and 8 grams of fiber for only 8 grams of sugar. I also endorse Arnold’s because it is filled with whole grains and it doesn’t contain high fructose corn syrup (HFCS), which Princeton and others have concluded is processed differently than other sugars by the body and significantly increases the likelihood for body fat to be produced. When eating clean and doing high levels of aerobic exercise, the goal is to make as much muscle as visible as possible. HFCS can contain up to 80% fructose while table sugar only contains about 50%; the increase in fructose can contribute to an increase in obesity and insulin resistance. With HFCS in just about everything, I’m glad I’m able to purchase Arnold’s who has a commitment to avoid using it.
I chose natural peanut butter for much the same reasons. Smucker’s natural peanut butter contains two items: peanuts and salt. That is really what peanut butter should be; most non-natural brands contain HFCS and other additives which negate the health benefits unsaturated fats in peanut butter provide. Others natural brands add unnecessary oils. Smucker’s contains peanuts and salt. The less processed the item the better. Most major brand peanut butters contain unnecessary additives and preservatives when all you really need is peanuts. If peanuts are not the first ingredient in peanut butter, and you’d be surprised how many brands this is true for, don’t buy them. According to this HFCS-free list, Skippy peanut butter also contains no HFCS. Smucker’s runs you 200 calories per Tbs; eyeballing it, I usually use about two Tbs. For 400 calories of peanut butter, healthy fats, and 20 grams of protein, it’s delicious. The sandwich totals out at about 620 calories with 30 grams of protein, a bunch of fiber, and a lot of healthy fats that contribute to overall health. Peanut butter contains high levels of monounsaturated fats which fight hunger pangs, are good for your heart, and help lower your cholesterol.
Another snack item that I consumed yesterday was the Snicker’s protein bar seen in the photo. I had this guy right when I woke up. It’s 290 calories, has 20 grams of protein, is fortified with lots of vitamins, and amazing 10 grams of fiber. If you want to feel full, eat one of these. The fat, fiber, and protein will all help deflect hunger pangs. The drawback to these bars is that they can be high in sugar and contain HFCS. This particular bar contains 22 grams of sugar and lists HFCS as one of its last items in the ingredients. Admittedly, I had one of these to indulge. There are healthier and more natural protein bars but this one is my favorite taste wise.
Throughout the day, I drank nearly 3 gallons of water. That may seem excessive, but the ever reliable Wikipedia says water intoxication occurs at much higher levels than the recommended 1-2 liters of water per day. The strenuous exercise coupled with daily hydration needs has me drinking like a camel. I love George Carlin, but when he asks “When did America become so thirsty?” I can only respond: when they found out how powerful of a life tool proper hydration can be. Water consumption has many obvious and not so obvious benefits: water keeps you hydrated, your muscles lubricated, helps prevent tears, pulls, strains, and sprains, improves brain function, and keeps you feeling full.
Adding everything up (1 PB sandwich, 3 Chobanis, 2 Snickers bars), I was up to about 1,500 calories, 100 grams of protein, lower levels of sugar, tons of water, and 42 grams of fiber, I was short in my caloric intake goal as well as my protein goal. To supplement this, I consumed about 50 grams of protein via shakes , just Optimum Nutrition Natural Chocolate Protein, HFCS-free, mixed with water, twice. Once before the gym once directly after. I also consumed 20 grams of protein via Optimum Nutrition Cassein Peanut Butter Chocolate protein directly before bed. This added approximately 550 more calories and 120 more grams of protein for a total day of 2050 calories and 220 grams of protein. Day 1 was a success.
It is advantageous at any level of baseball for a hitter to force a pitcher to throw more pitches to them during an at-bat. The advantages are plentiful: with more pitches, the hitter increases their odds of seeing a pitch in the strike zone, it increases the pitcher’s workload, and it increases the odds that a pitcher will make a mistake via either sheer numbers or fatigue.
A topic of concern for many Phillies’ fans has been their perceived lack of offense. When I explored this topic on May 28, I discovered that while the Phillies’ offensive numbers are trending down, their pitching numbers are trending in a positive direction that nearly doubles the decay the offense is facing. Jayson Werth‘s departure left many Phillies’ fans hoping Ruben Amaro Jr. would acquire a right-handed bat to help balance out the lefty-heavy lineup and ease lefty Domonic Brown into a role as an everyday Major League player. Ruben dashed those hopes last week by stating, “You will not see a major move.”
While Werth put up many impressive numbers as a Phillie, his most impressive may be his pitches seen per plate appearance. In 2008, Werth averaged 4.51 per plate appearance in the heavier half of a platoon with Geoff Jenkins that would have led the league had he had enough plate appearances to qualify. Werth led the league in 2009 and 2010 with 4.50 and 4.37 pitches per plate appearance seen respectively. Despite a declining triple slash line, Werth is 3rd in the NL in 2011 as of June 13, 2011 with 4.27 pitches per plate appearance seen.
Werth’s breakout season of 2009 saw the Phillies’ score the 2nd most runs per game out of their four playoff seasons. In 2007, the highest scoring for any Phillies’ playoff team for the last four years, the Phillies had Pat Burrell and Ryan Howard, respectively, at second and third in the NL in pitches seen, with Chase Utley ranking 22nd and Jimmy Rollins 32nd.
There is a direct value in seeing pitches per at-bat, too. At least it seems that way with this group of Phillies. The Phillies ratio of average pitches seen per plate appearances by regulars compared to their runs scored per game indicates that pitches seen per at-bat become significantly more valuable as your offense output decreases. The graph below illustrates that the Phillies have increased their runs per pitches seen per plate appearance in three out of the last four opportunities, season to season, implying that they have capitalized on pitch counts. Click on the thumbnail for a full-sized graph.
Through this, the Phillies have done more by seeing less over the last few seasons. The graph below illustrates the pitches seen per AB of each of the regulars from 2007-2011. Click on the thumbnail for a full-sized graph.
Admittedly, the graph assumes a lot. It gives Wes Helms the nod at 3rd base for the 2007 season because he had more PA’s there than Abraham Nunez. It assumes Shane Victorino was the every day right fielder for the 2007 Phillies despite them having a revolving door there for a large portion of the season. Werth gets the 2008 nod in RF because of him out PA’ing Jenkins in RF; same thing for Chooch and his back-ups in 2007 and 2008. The model is slightly statistically flawed, too; the averages are based on averages of an ideal line-up based on the players featured. You’d be surprised how hard it is to find team information on pitches seen per plate appearance, even just averages. It does not quite exist in its desired form and unfortunately, I don’t have the time to come through one thousand-plus game logs.
The team average for pitches seen rose each year, from 2007-2010, likely due to strong performances by Howard and Burrell, the emergence of Werth, and the development of Ruiz and Victorino. Werth’s departure created a .44 pitch per at-bat differential in RF for the Phillies; .50 if you consider 2010 Werth v. 2011 Brown. The difference in average per player is .09375 pitches; double the gap created by Werth when comparing his 2011 to Brown’s 2011. While Werth is easiest to explain away the drop-off, it still barely off-sets the gains made by Howard, Rollins, and Victorino this season. Carlos Ruiz is the other culprit in pitches seen per AB dropping, with his .44 pitches per at-bat decrease matching the 2011 gap between Werth and Brown. Ruiz’s supporting cast features drops by Raul Ibanez (.19) and Chase Utley (.06). If anyone has full season pitches per PA data available and/or would like to help me extrapolate numbers by multiplying them out and finding true averages, I would love to see them and would love the help. Werth’s departure and Ruiz’s regression in P/PA indicate the Phillies’ are scoring more runs on less pitches, but also indicate that if they were seeing more pitches, they would likely score more runs.